
How to take control of your business growth using data
Apr 29, 2025
Dr. Weedy faced stagnant growth and lacked a clear way to measure and plan for improvements. Despite using tools like Google Analytics, they couldn’t make sense of the data. This case shows how data-driven processes helped them gain clarity and regain control over their business growth.
Challenges with Revenue Growth and Data-Driven Planning
Dr. Weedy struggled with two main issues:
Lack of Revenue Growth: They had ideas for growth, but there was no clear way to assess or measure them. Revenue had stagnated, and the team was uncertain about which changes would lead to improvements.
Lack of a Clear Planning Method: Without reliable data, it was difficult to evaluate the effectiveness of marketing and sales efforts. Their decisions were based on assumptions, not actionable data, which made it hard to move forward with confidence.
While they had Google Analytics in place, it wasn’t delivering the expected results. The data was unclear and the tools were confusing for the team.
Implementing Data-Driven Processes to Drive Revenue Growth
To address these challenges, we implemented a comprehensive data-driven strategy:
Deciding on a Long-Term Goal: The first step was aligning the team around a clear goal — increasing revenue. By prioritizing revenue, the team could focus on the right metrics to drive growth.
Creating the Metrics Tree: We developed a metrics tree to guide decision-making, tracking key metrics that directly impacted revenue. This tree simplified the process of measuring performance and making data-driven decisions.
Setting Up the Dashboard in Amplitude: We set up data collection and built a dashboard in Amplitude, tracking key metrics like revenue, conversion rates (CR), daily active users (DAU), and performance by state and ad campaigns. This allowed the team to monitor performance in real time and act quickly on insights.
Data Quality Check: We ensured all data was clean and free of errors, providing a reliable foundation for analysis and decision-making.
Educational Workshops: We conducted workshops to help the team understand the data and integrate it into their daily routines. This empowered them to take ownership of the data-driven approach.
How Did It Influence the Company
After we implemented analytics, several key changes were made to the way the team works with data:
- Setting Up Data Collection and Amplitude Dashboard: We set up data collection and created a dashboard in Amplitude, which now tracks key metrics like revenue, conversion rate (CR), daily active users (DAU), and even provides analytics by state and ad performance. This dashboard allowed the team to monitor performance in real time and react to issues quickly.

Examples of charts on the dashboard
- Using the Metrics Tree: In weekly meetings, the team reviews the metrics tree to identify which areas need improvement in order to drive revenue. Every new idea is evaluated based on its impact on these metrics, ensuring that the team stays focused on what really matters.

Dr. Weedy's Metrics Tree
- Amplitude and Alerts: We set up Amplitude for daily monitoring of metrics, with automated alerts for critical events, like when revenue drops below a certain threshold. These alerts help the team react quickly and address issues before they affect the business.
- Data-Driven Meetings: Weekly meetings are now based on data. Instead of discussing hypothetical plans, the team looks at the real performance of what was previously implemented. They evaluate the changes, compare them to the set goals, and make adjustments accordingly.
Boost Revenue by Optimizing Email Funnel
A key focus was optimizing the email funnel for customer retention. Since Dr. Weedy’s service required annual renewal, engaging clients through email was essential.
We integrated analytics to track:
Open rates
Clicks on links
Conversion at each stage
By optimizing the email flow based on this data, the team was able to re-engage customers, leading to increased revenue through repeat purchases.
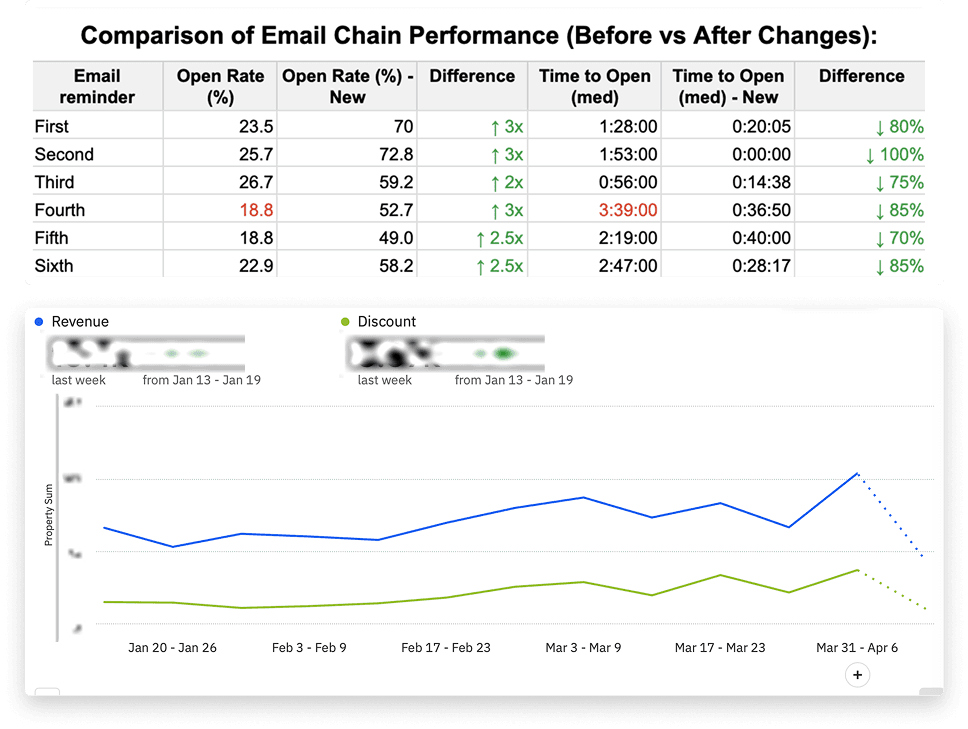
Email Performance Results
Side Effect: Transparency in Management
Before analytics, the two co-founders shared responsibilities, which led to confusion and overlapping duties. Once the metrics were clear, they could divide responsibilities more effectively:
One co-founder focused on marketing (optimizing Google Ads, SEO, etc.).
The other took charge of product development.
This shift allowed for better efficiency and faster decision-making, as the team had more clarity on roles and responsibilities.
Documentation for Client
After implementing analytics, we provided detailed documentation for Dr. Weedy’s team. This documentation explained how to work with the data, including definitions of key metrics (like revenue) and methods for tracking performance across different states and marketing channels. The documentation ensures the team can continue to use the data independently and make informed decisions moving forward.
Drive Better In-Product Conversions with CJM Analysis
We also prepared for future improvements with CJM (Customer Journey Mapping) analysis. While Dr. Weedy hasn’t started working on this yet, we conducted a thorough analysis to identify insights for optimizing the customer journey.
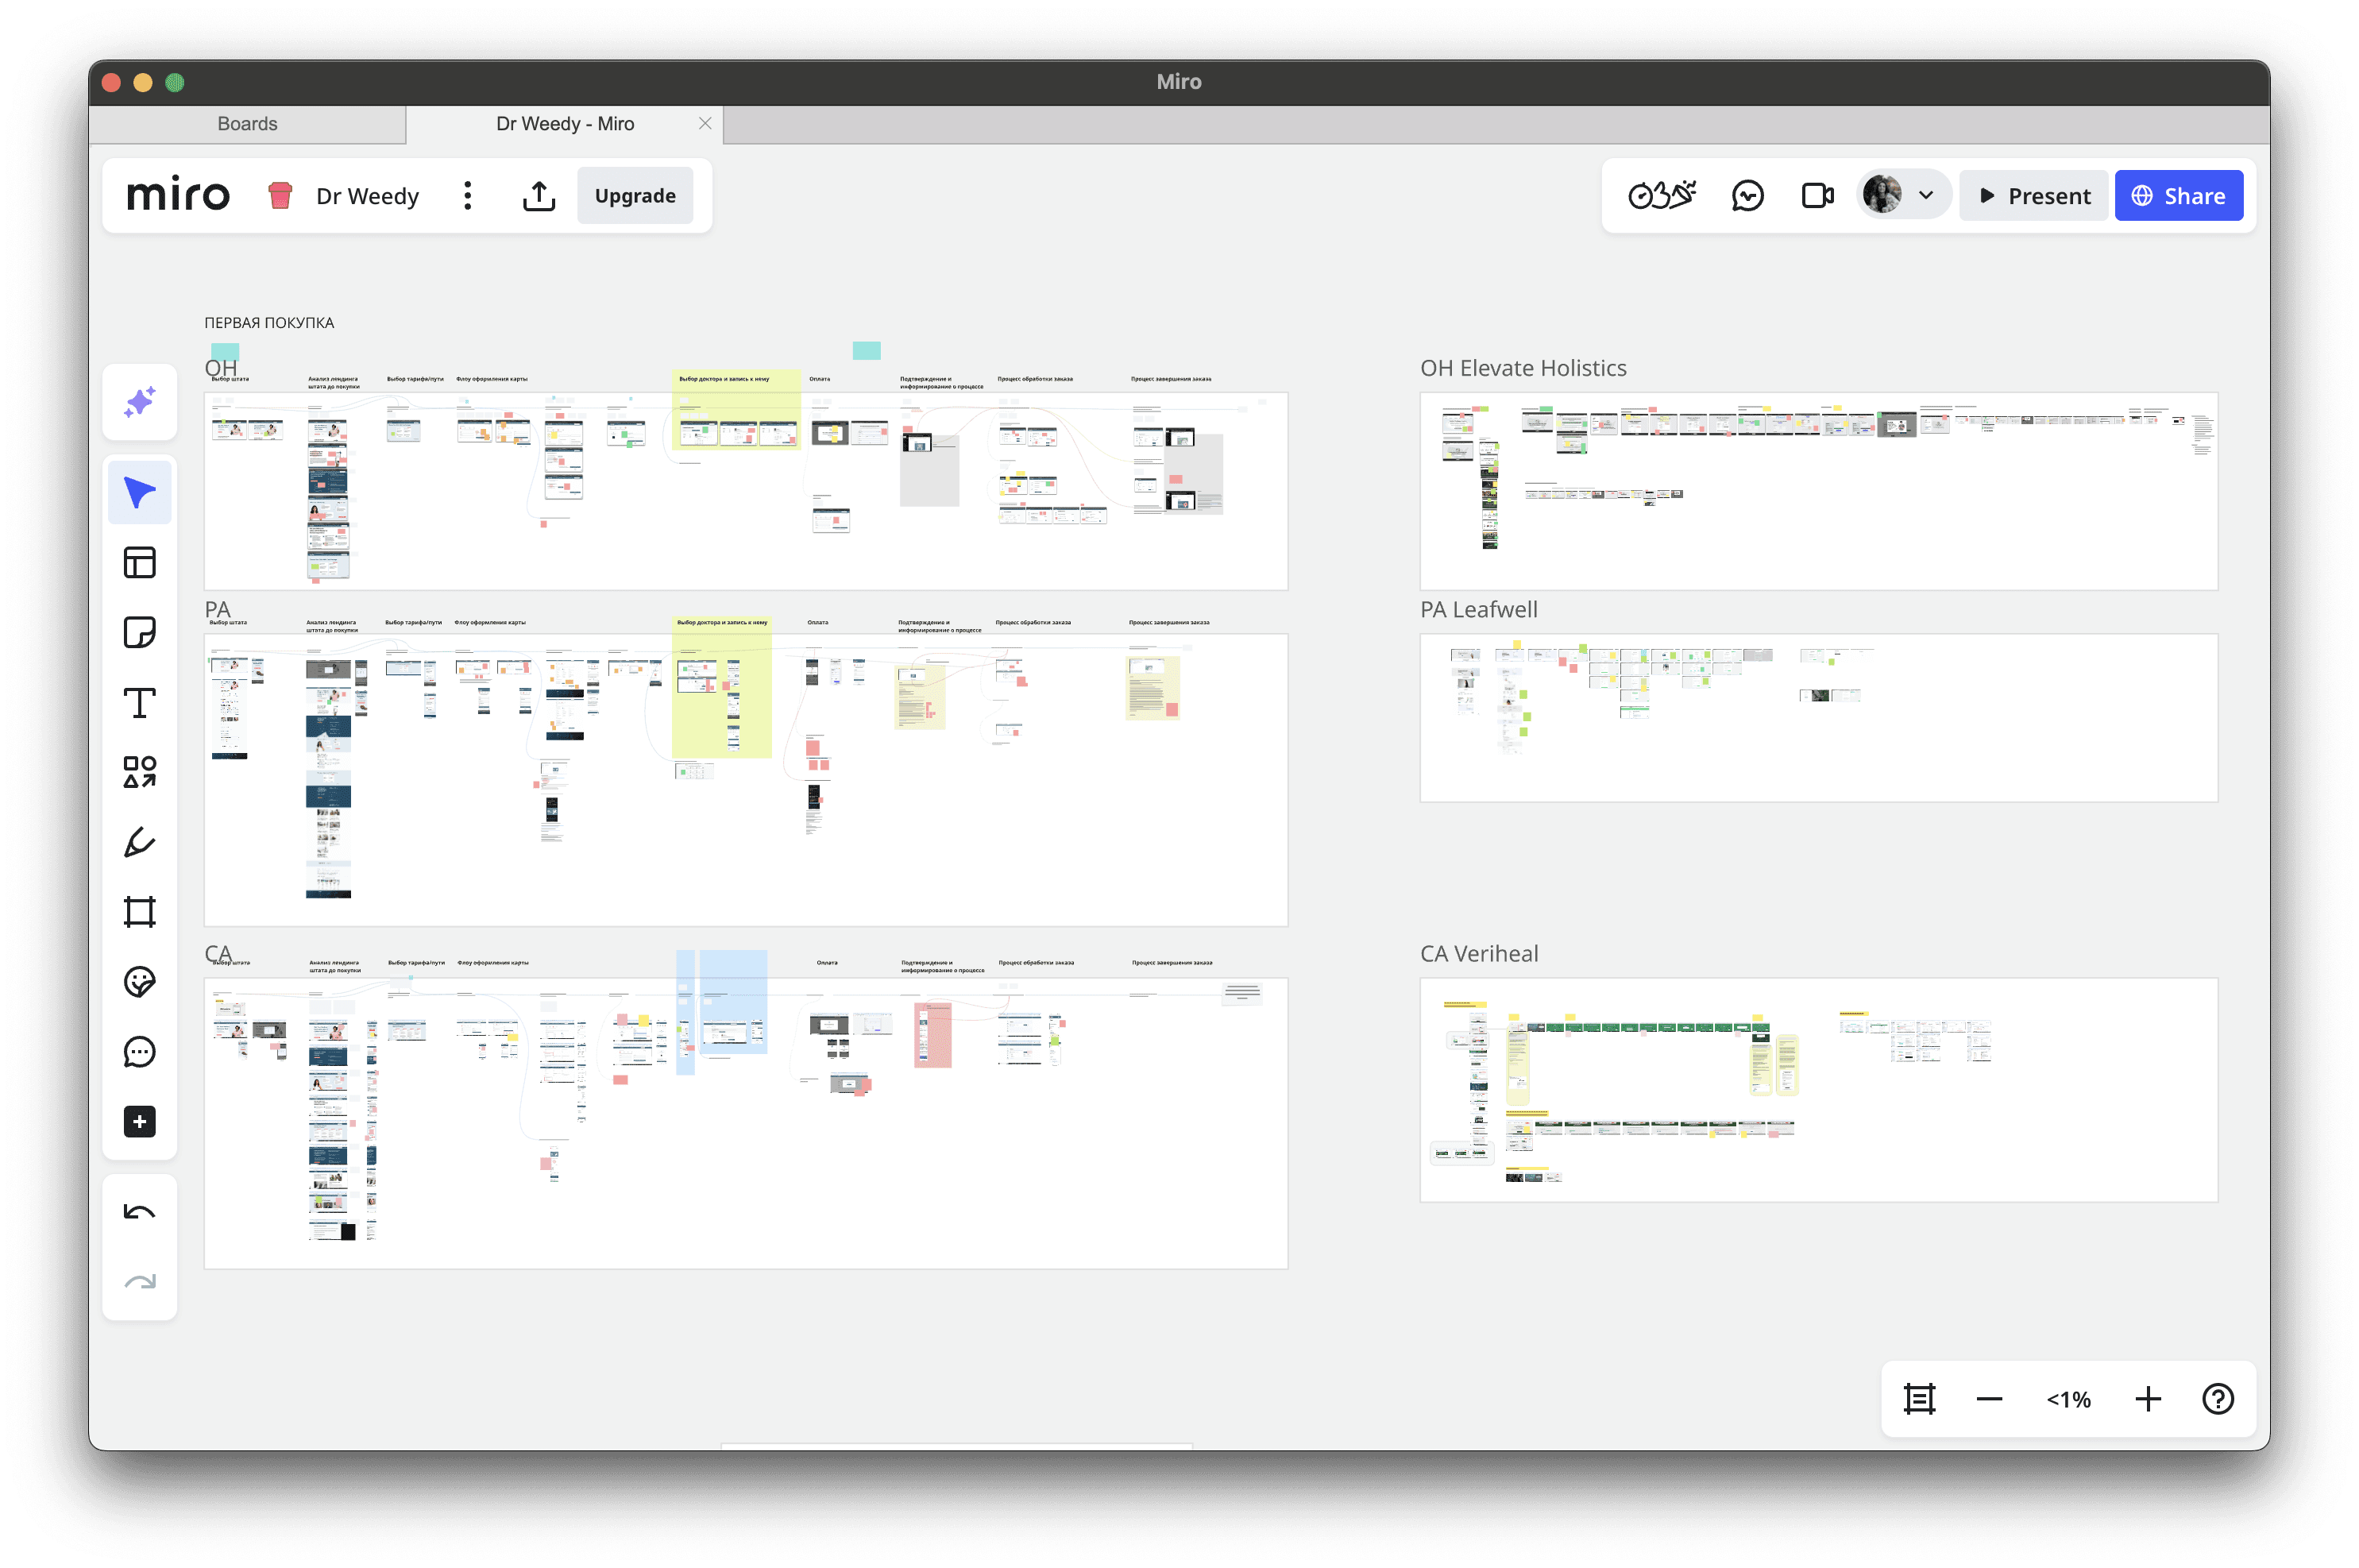
CJM Analysis
We analyzed the customer path across three states (out of 18) and compared it with three main competitors. By acting as secret shoppers, we gathered insights that will help Dr. Weedy optimize conversions and improve customer experience.
Using the RICE framework (Reach, Impact, Confidence, Effort), we prioritized hypotheses for improving conversions. The groundwork is in place for Dr. Weedy to optimize the customer journey when they’re ready to focus on it.
What does the client say: Start by Focusing on a Clear Goal
Natalia Atarshchikova, COO of Dr. Weedy
At first, we didn’t have a clear focus, which made using data difficult. But once we decided to prioritize revenue, everything changed. Data became our guide to driving growth, showing us exactly what to focus on. Start by focusing on a clear goal, and let the data show you the way.